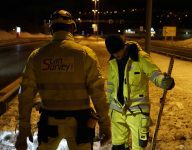
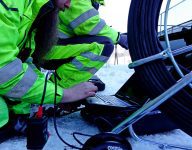
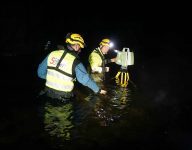
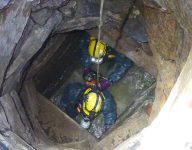
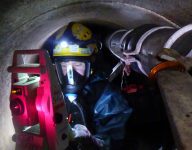
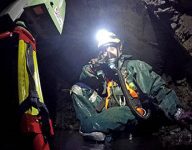
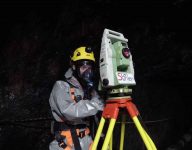
Obtaining detailed records of water and sewerage systems has always been important, especially in ensuring progress and economic stability in the development of new infrastructure. Traditionally, this information has been obtained through a process of manual registration, where the surveyor would note the depth, direction, and dimensions of each pipeline in a manhole. He or she would also take a picture. Later, an engineer could “model” the pipelines, drawing straight lines from manhole to manhole. Needless to say, this method is highly inaccurate. Through self-developed measurement methods, we can now provide 3D-models of both manholes and pipelines.
3D-Manholes
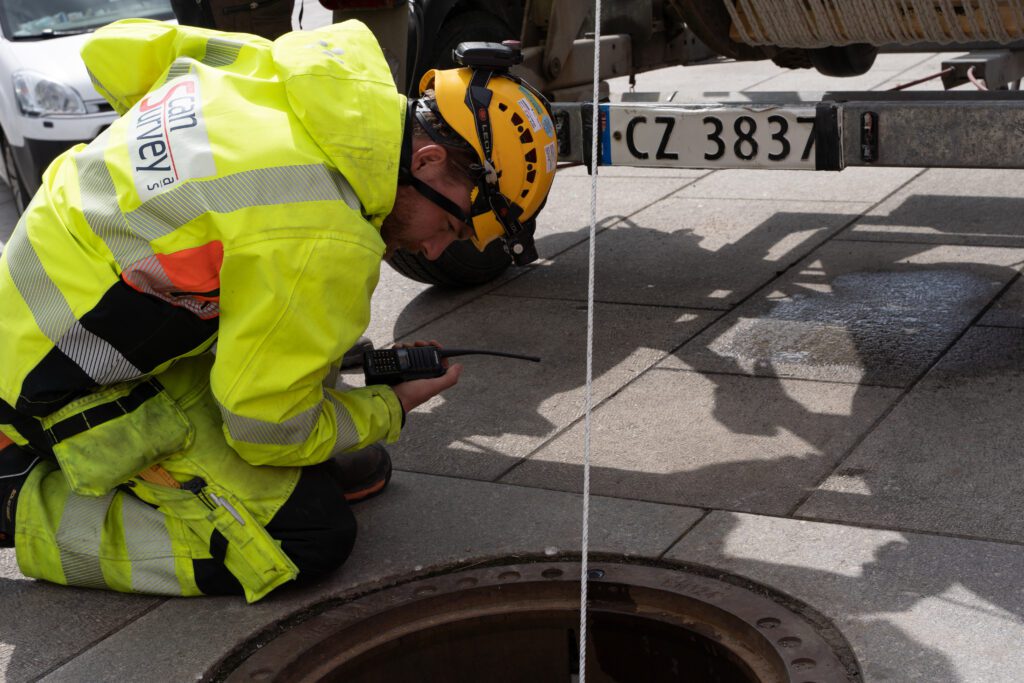
With the traditional registration of water and sewerage systems, the surveyor would note the depth, direction, and dimensions of pipe openings and pipelines in manholes and utility vaults. In many cases, this proves sufficient.
On the other hand, there are many situations where this method is too inaccurate. If the manhole is close to other utilities, especially in cities, it’s crucial to know the positions, heights, bearings, and dimensions of pipelines to a high degree of accuracy. Compared to our methods, traditional registration is rather rough.
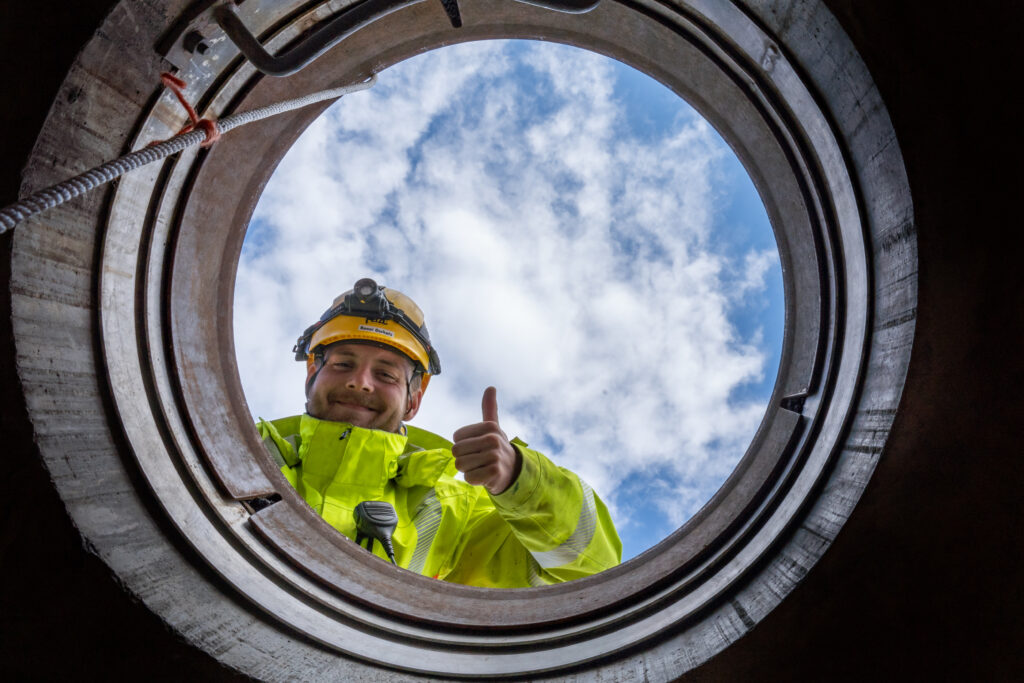
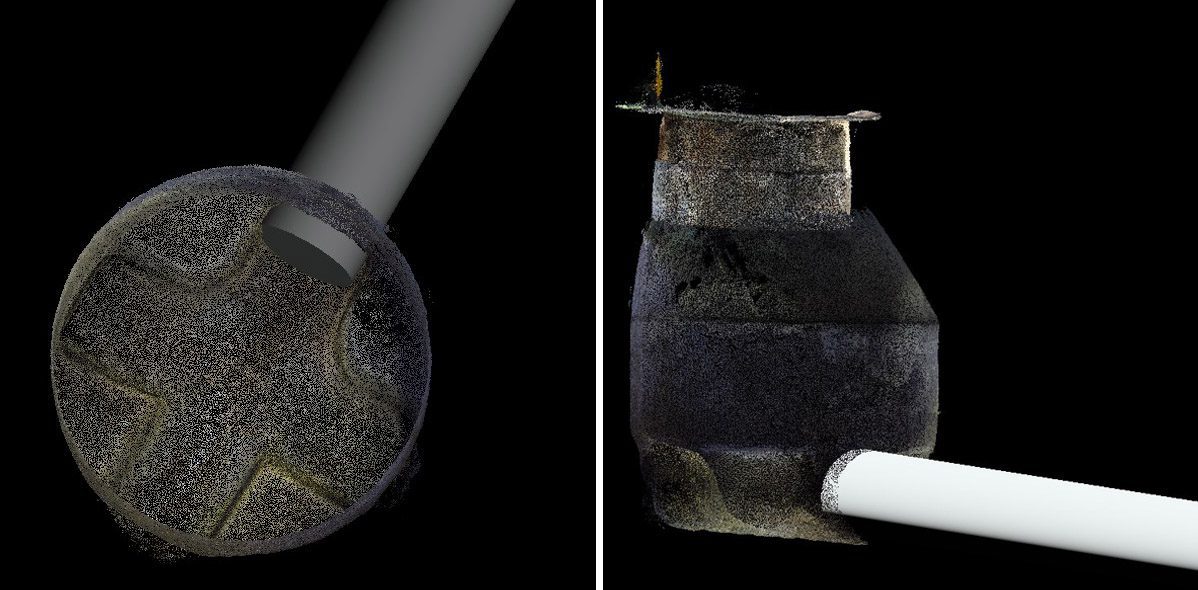
The same technology that has been used for decades in creating maps from aerial photos, known as photogrammetry, is now what we use to document manholes and utility vaults. By taking anything between 20 to 100 images inside a manhole we’re able to create a point cloud with high density and accuracy. This process is called 3D-Manholes.
A camera is fastened to a telescope pole, which can reach up to 6 meters down into the manhole; allowing a level of detail that is impossible to maintain from ground level. The photo-taking process takes between 5-10 minutes, and data processing is mostly automatic – making the process even more efficient.The method is also inexpensive; the final cost is only twice that of traditional manhole schematics.
Would you like to know more? Contact our Head of Department!
Products
In the simplest of circumstances only the point cloud is delivered to the customer. It is georeferenced and RGB-colored, having, under ideal conditions, an accuracy of 1cm in the horizontal and vertical plane. Programs such as AutoCad and Gemini can digitize points, lines, and volume objects from the point clouds. Scan Survey is able to generate the following products from the point cloud:
3D-PDF
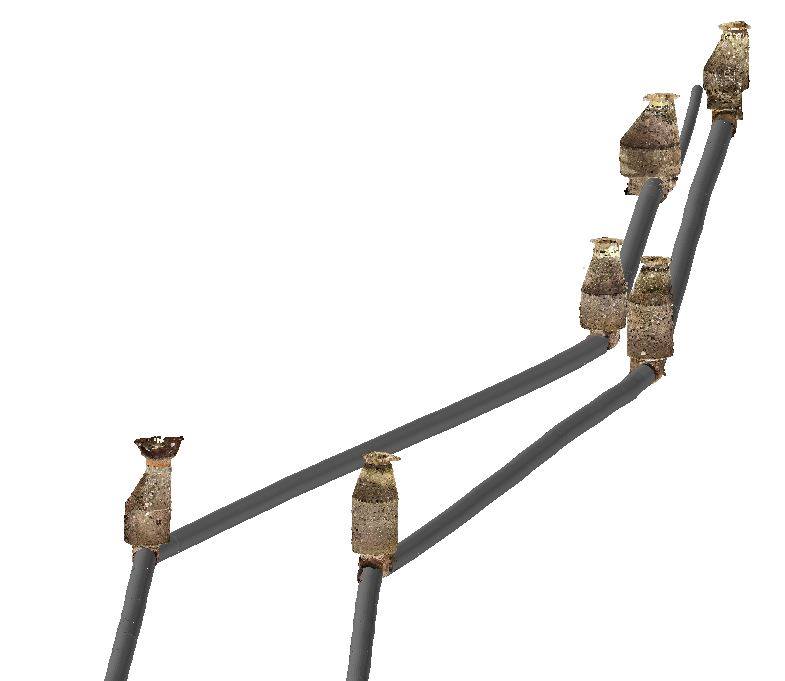
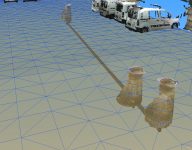
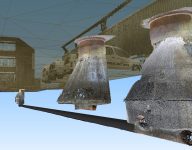
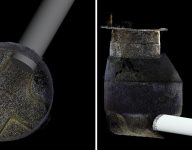
The point cloud can be triangulated into a 3D-mesh, and the images can be mapped on as texture. This object can be exported into a 3D-PDF, readable by Adobe Reader. In Adobe Reader, a program installed on most PCs, one can see the immense level of detail the texture gives. It’s easy to see materials, dimensions, construction, and condition within the model.
Due to the large coordinate values in the map projections UTM and NTM, the model must unfortunately be moved to origin. However, the model will be properly compass oriented, and heights will be correct (usually using the height system NN2000). Simple measurements can be collected from the model.
A 3D-PDF is well suited for providing insight into existing manholes for design purposes, but can also be used as “as built” documentation.
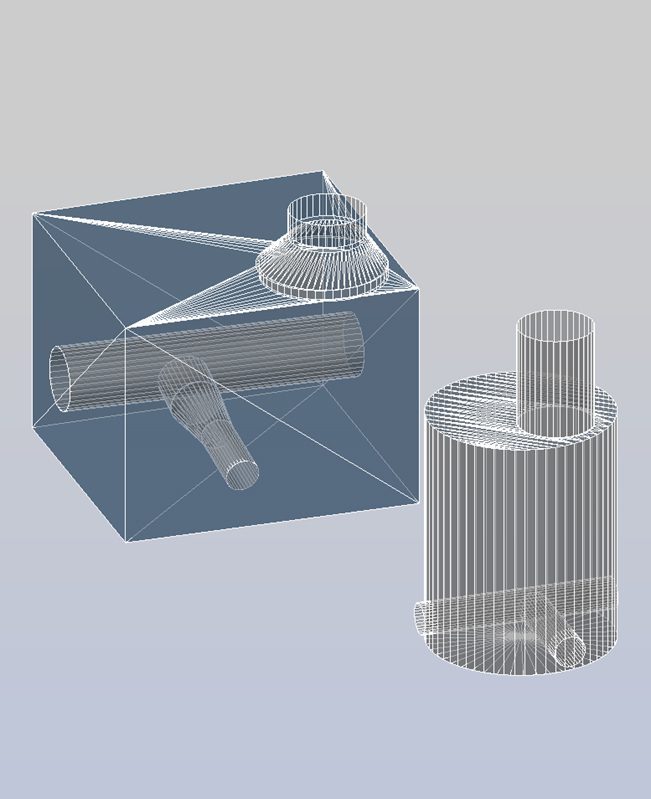
Model – Volume Objects
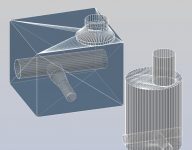
We can model solids with various characteristics and geometry from the point cloud, for further development in programs such as AutoCAD and Revit. This is far more informative and easy to work with for engineers as the product is a CAD / BIM model. Each solid is give a descriptive name and placed in separate layers. These layers can then be exported to DXF / DWG.
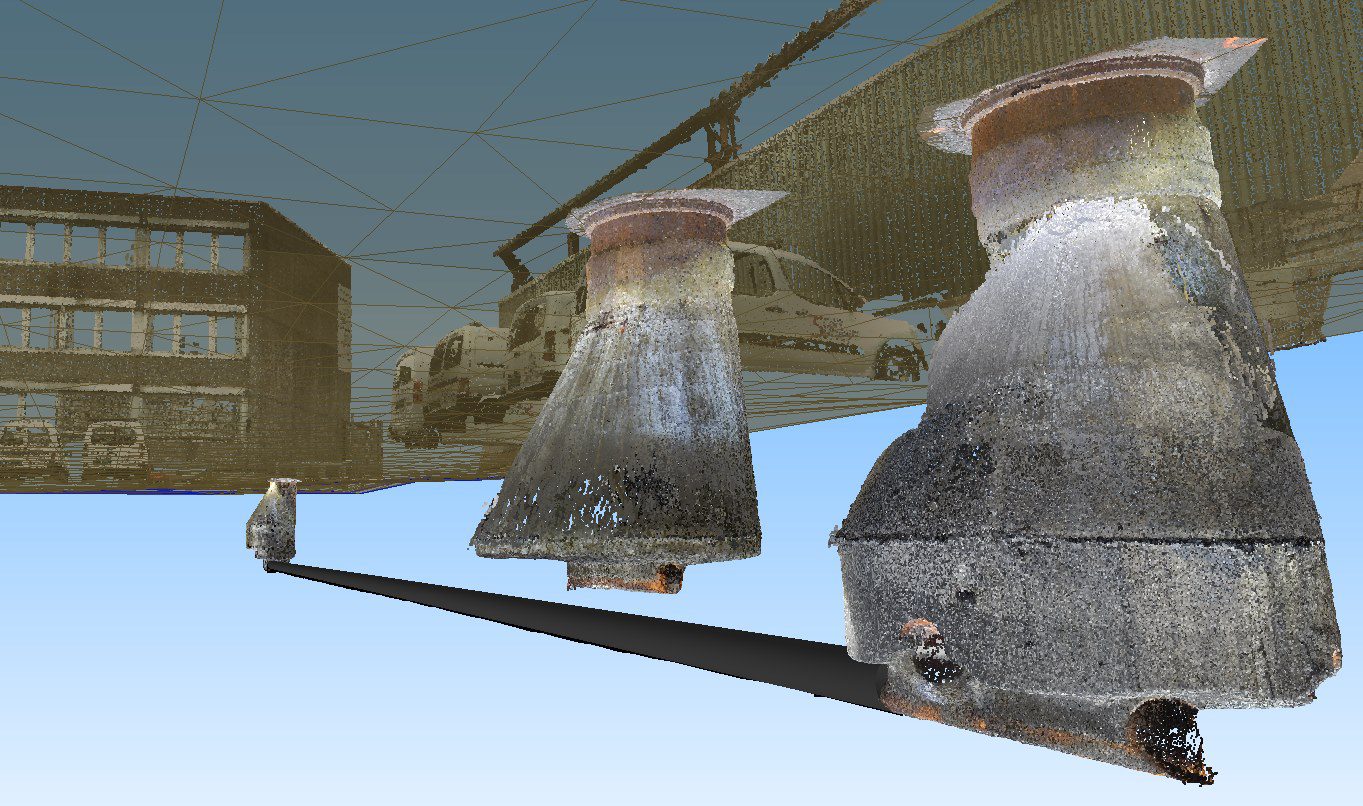
3D-Pipelines
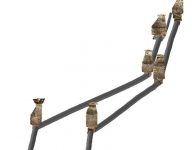
Data records of water and sewerage systems are often sparse, or inaccurate. Pipelines are often drawn as straight lines on a map, when in reality they run through ditches adapted to the available terrain. Mistakes or errors in the planning stages can lead to delays or economic loss in the building process.
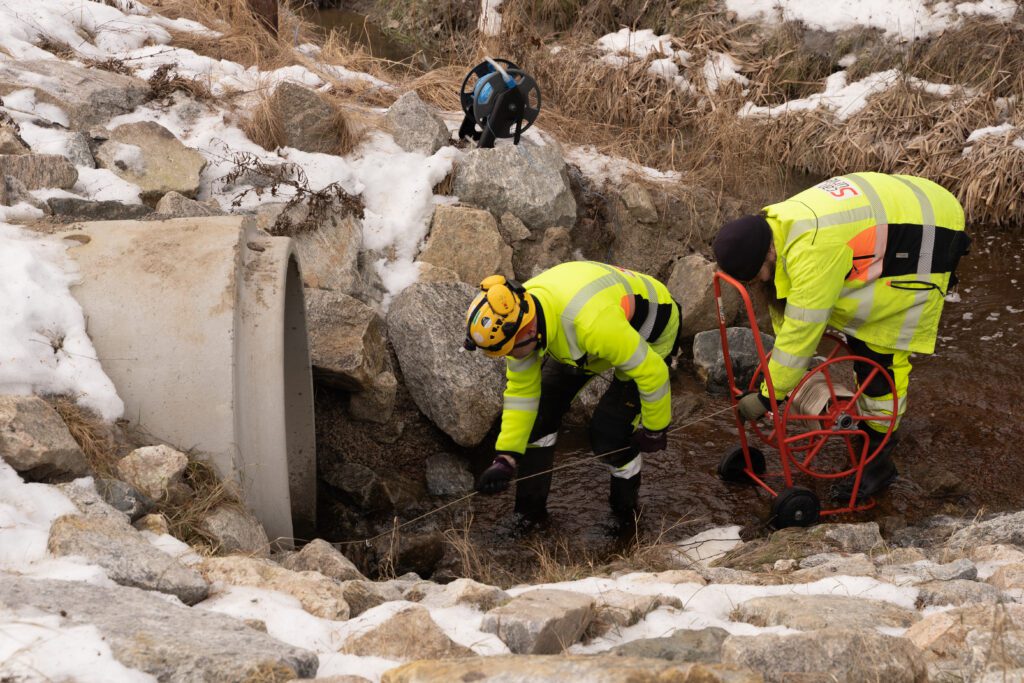
Traditionally, slit trenching has been utilized to reveal the location of pipelines underground. This only gives a spot-location, while the excavation of the pipelines itself can be disturbing to the terrain, not to mention an expensive process. Scan Survey has invested in measuring equipment that rectifies these disadvantages. This solution is what we call 3D-Pipelines.
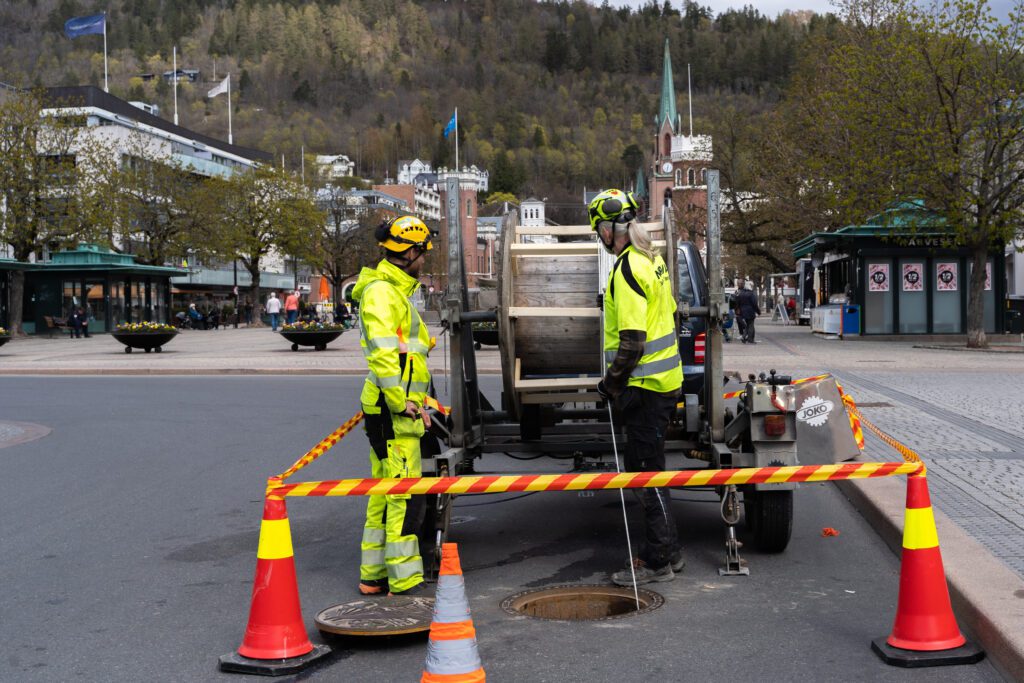
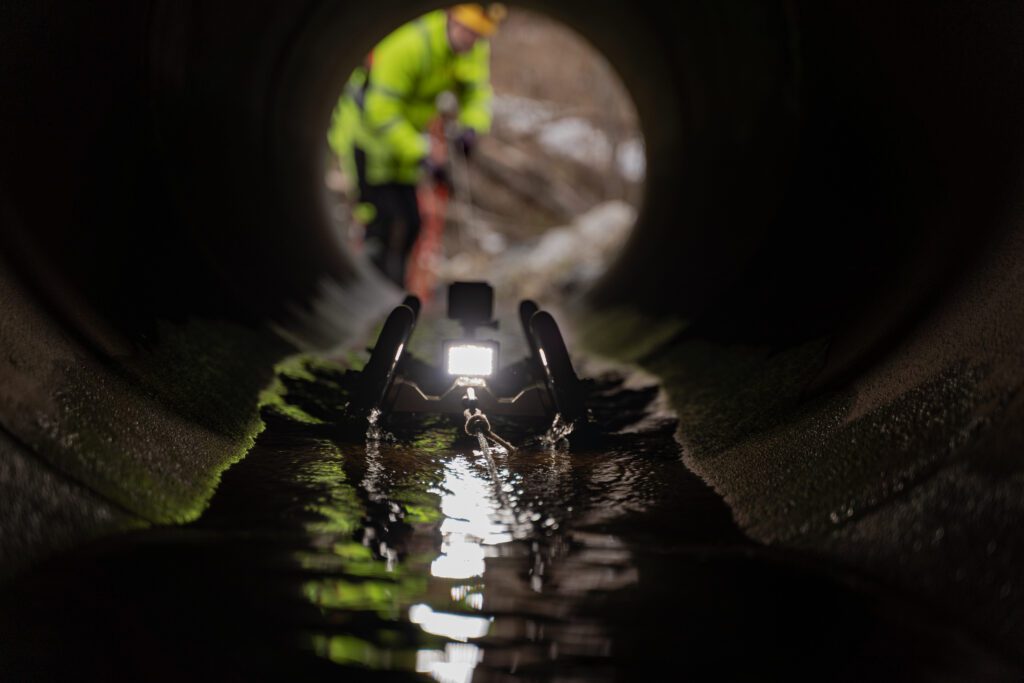
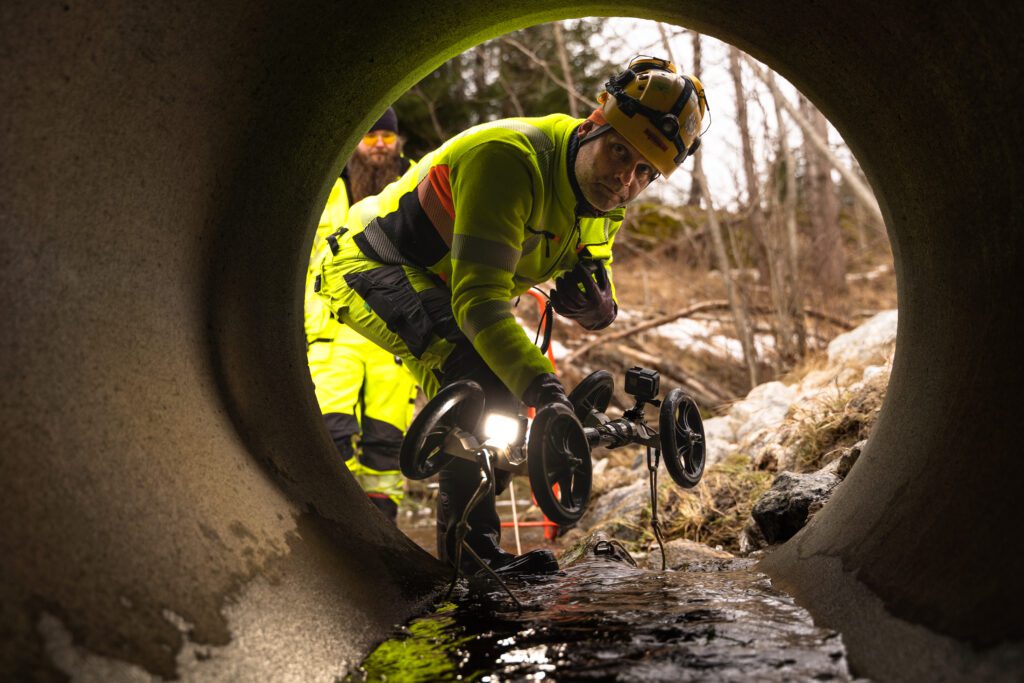
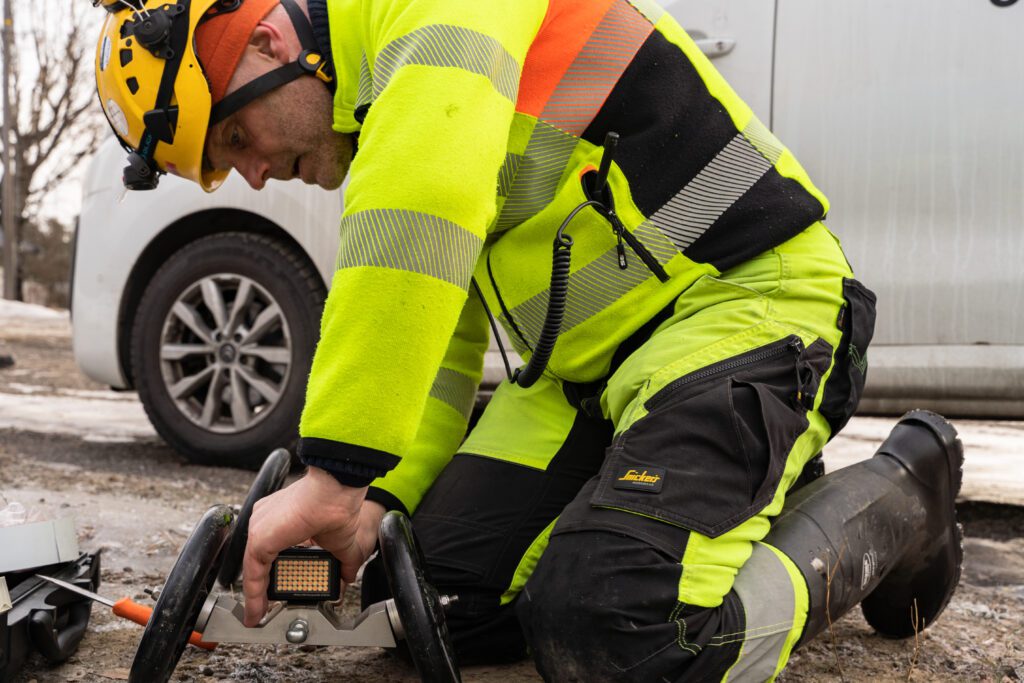
The measuring equipment is a probe that is physically pulled through the pipe. The probe contains an IMU capable of detecting directional changes during its journey. Combined with measurements of both the entrance and exit points, the client is left with a georeferenced line within a centimeter’s accuracy for pipe positioning. The probe can also be used on full profile boreholes.
Our equipment allows us to measure pipes with inner dimensions starting from 90mm and upwards, along lengths of up to 300m. The probe can be pulled through all sorts of pipes, such as cable conduits, sewerage lines, and storm drain pipes. Pressurized water pipes can also be measured, though this requires additional preparation.
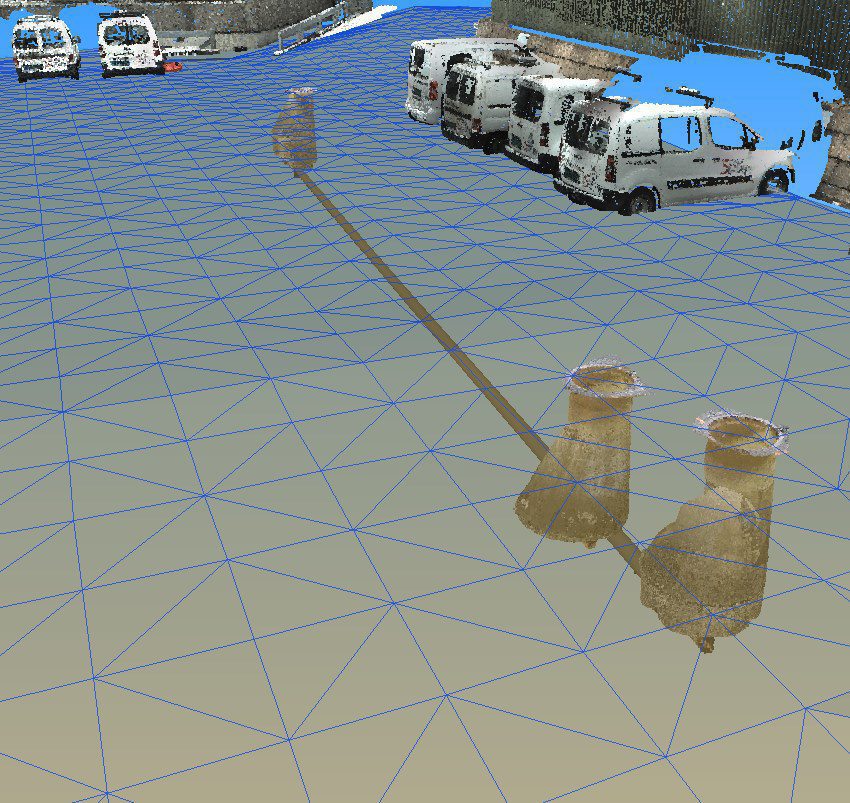
Our solution is economically competitive with a far more accurate result than those provided by slit trenching, georadar and camera inspection. The positional data can be modeled into a 3D volume object, whereupon additional information such as accuracy, date of measurement, and other metadata can be added. The finished product can be combined with camera inspection if required.
Combination with other Map Data
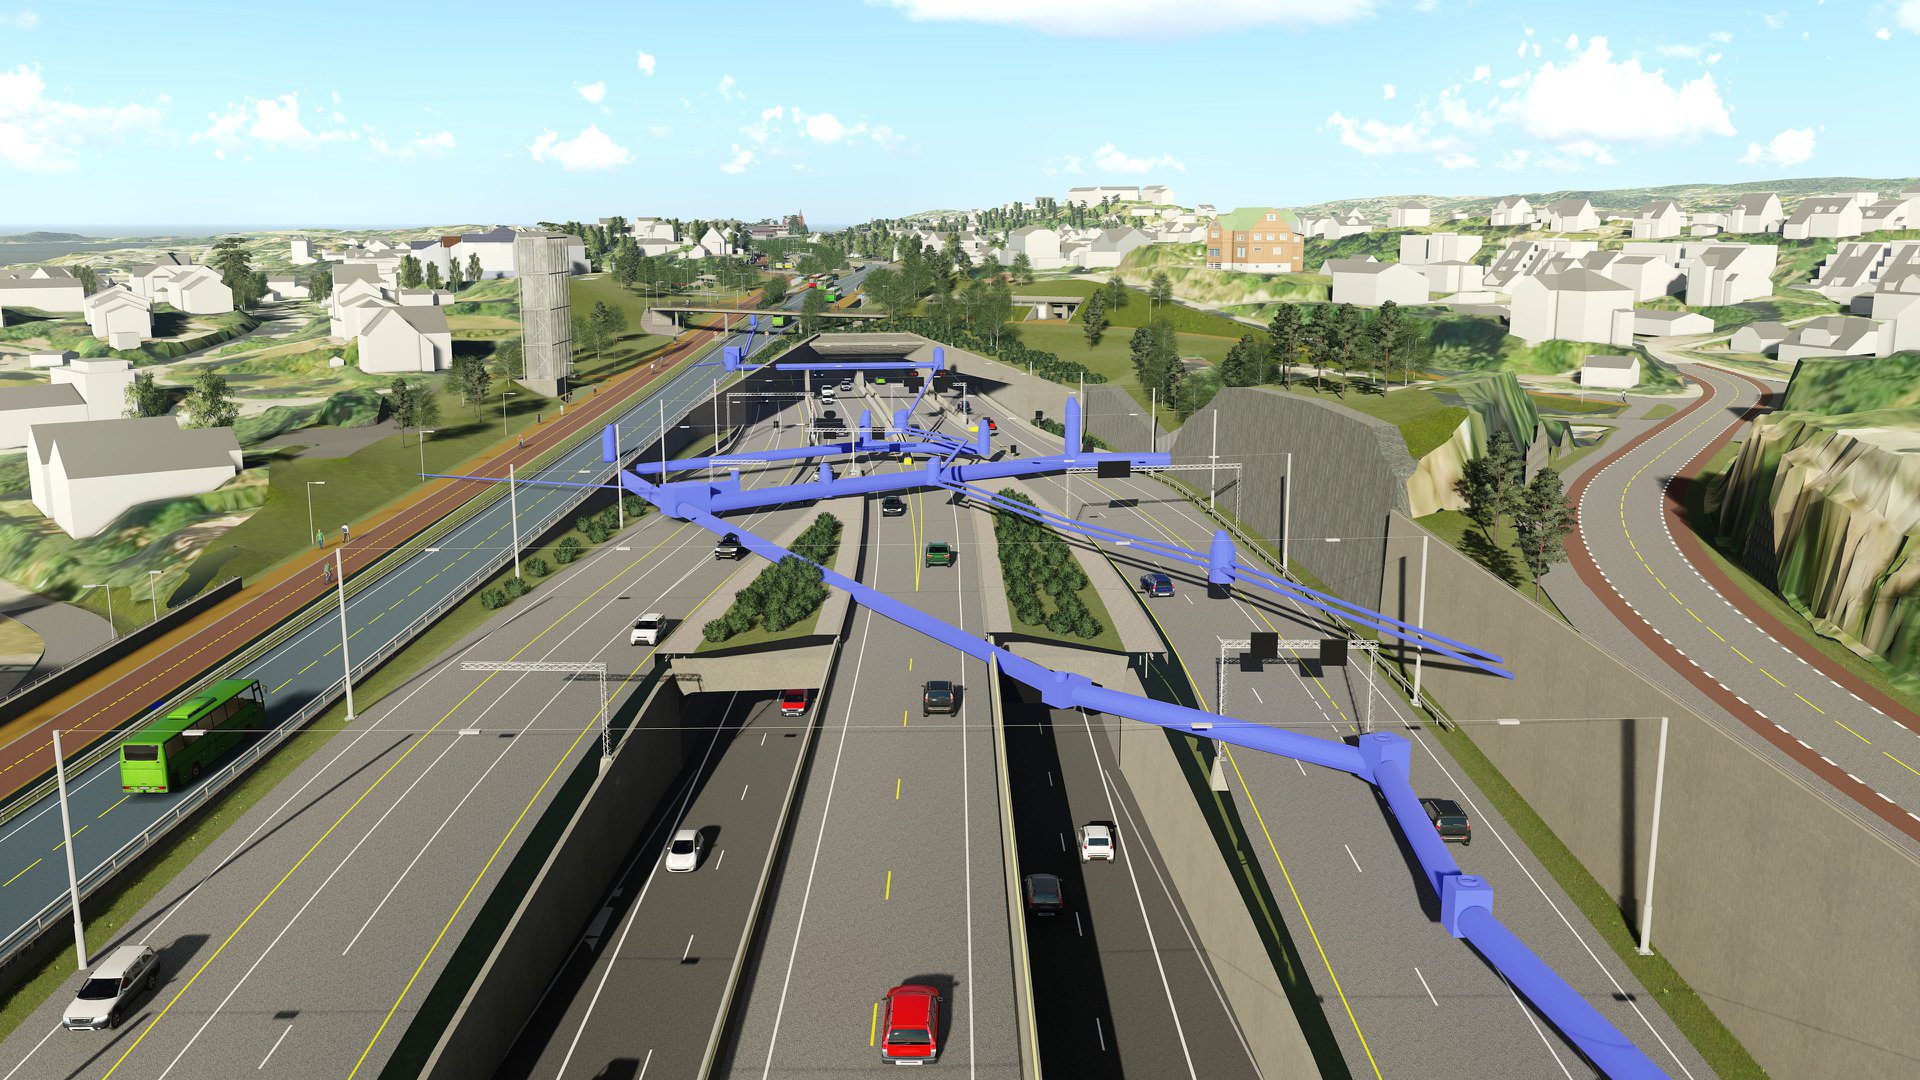
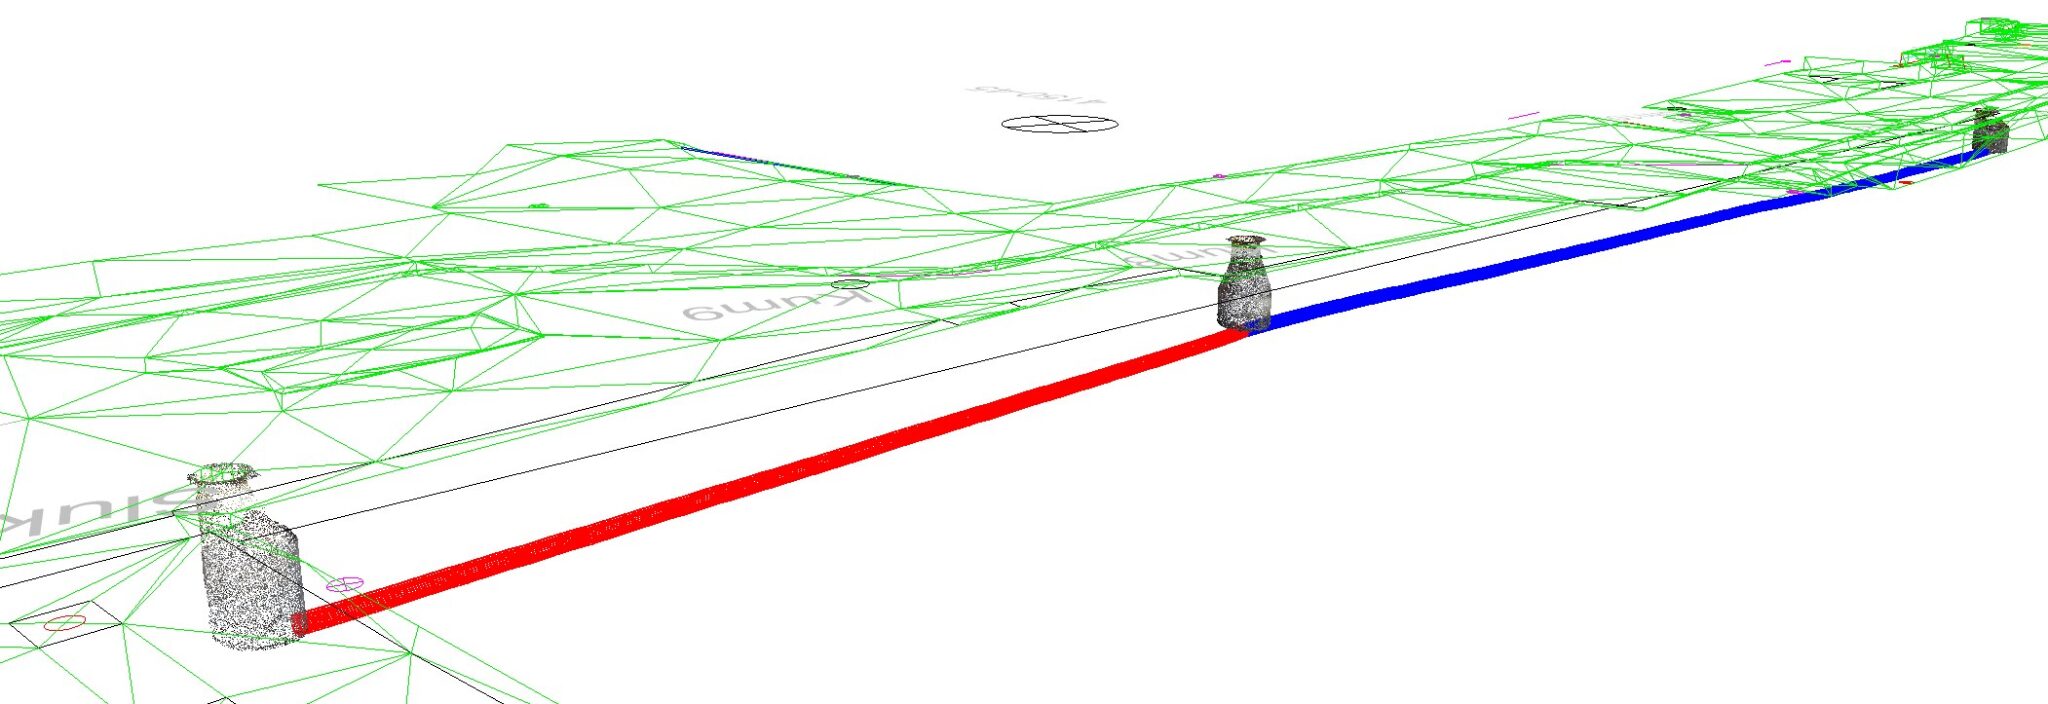
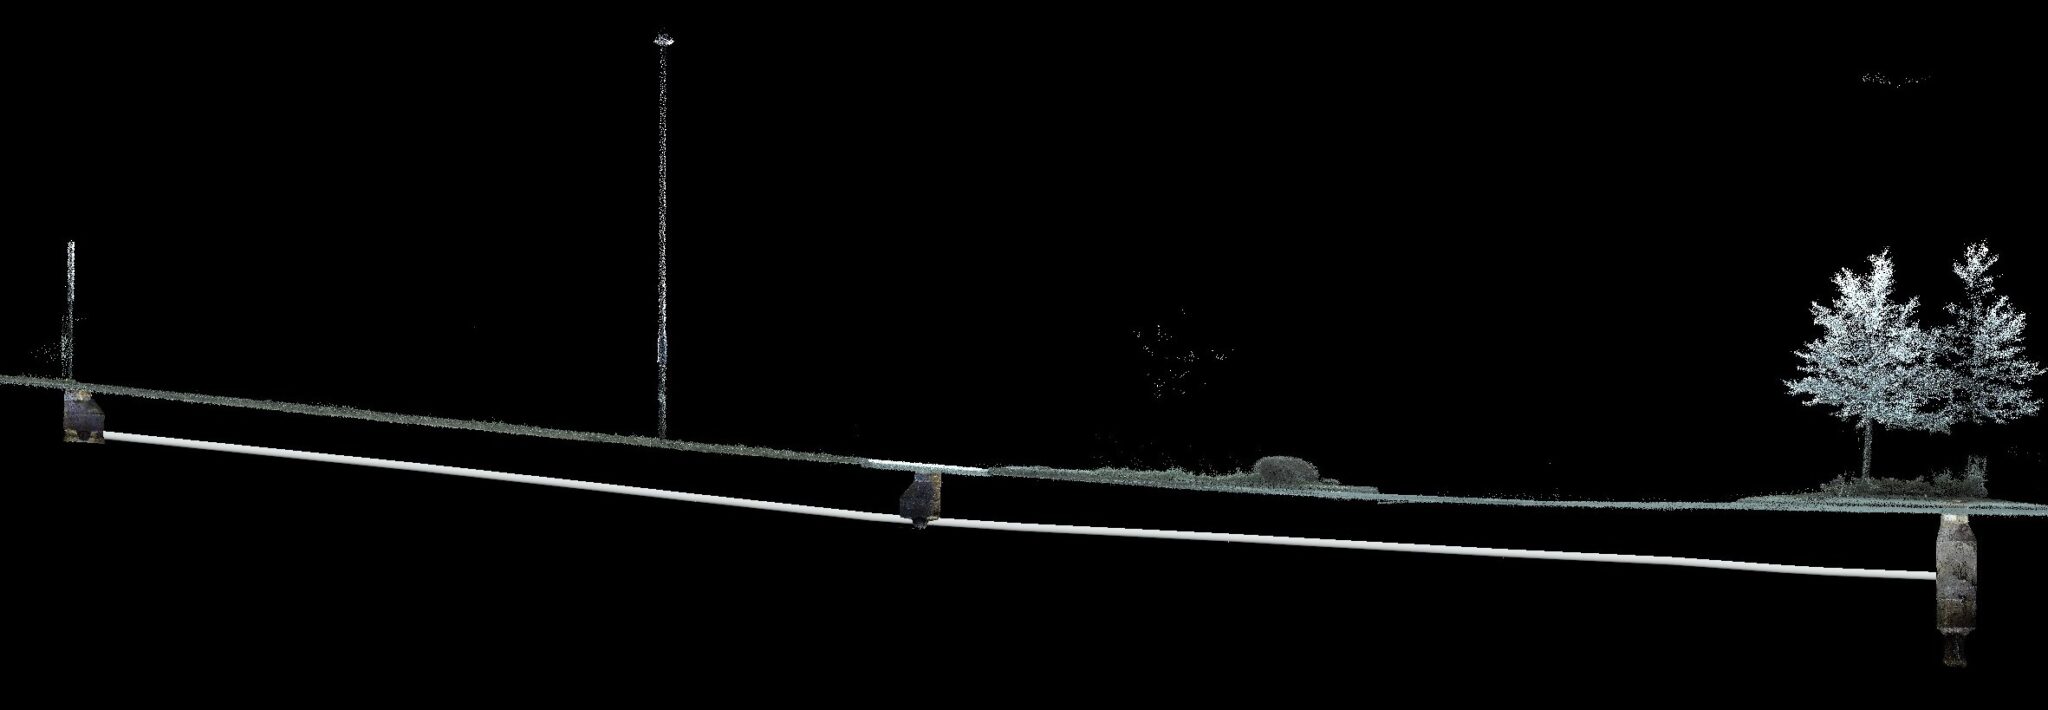
3D-Manholes and 3D-Pipelines has become an extremely useful product in projects where development is set to occur close to critical underground utilities. We have been lucky enough to use our solution on large projects such as IC Drammen and E18 Vestkorridoren.
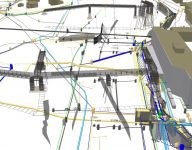
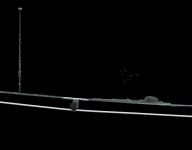
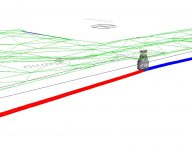
“Accurate data of existing water and sewerage systems in 3D is a must. 3D-scanning of pipelines and manholes has been extremely useful in connection with planning,” writes Vianova Trondheim on their Facebook page. The images collected from his page show existing storm drain pipes (in blue) floating in the air over the newly projected e18 Lysaker Ramstadsletta.
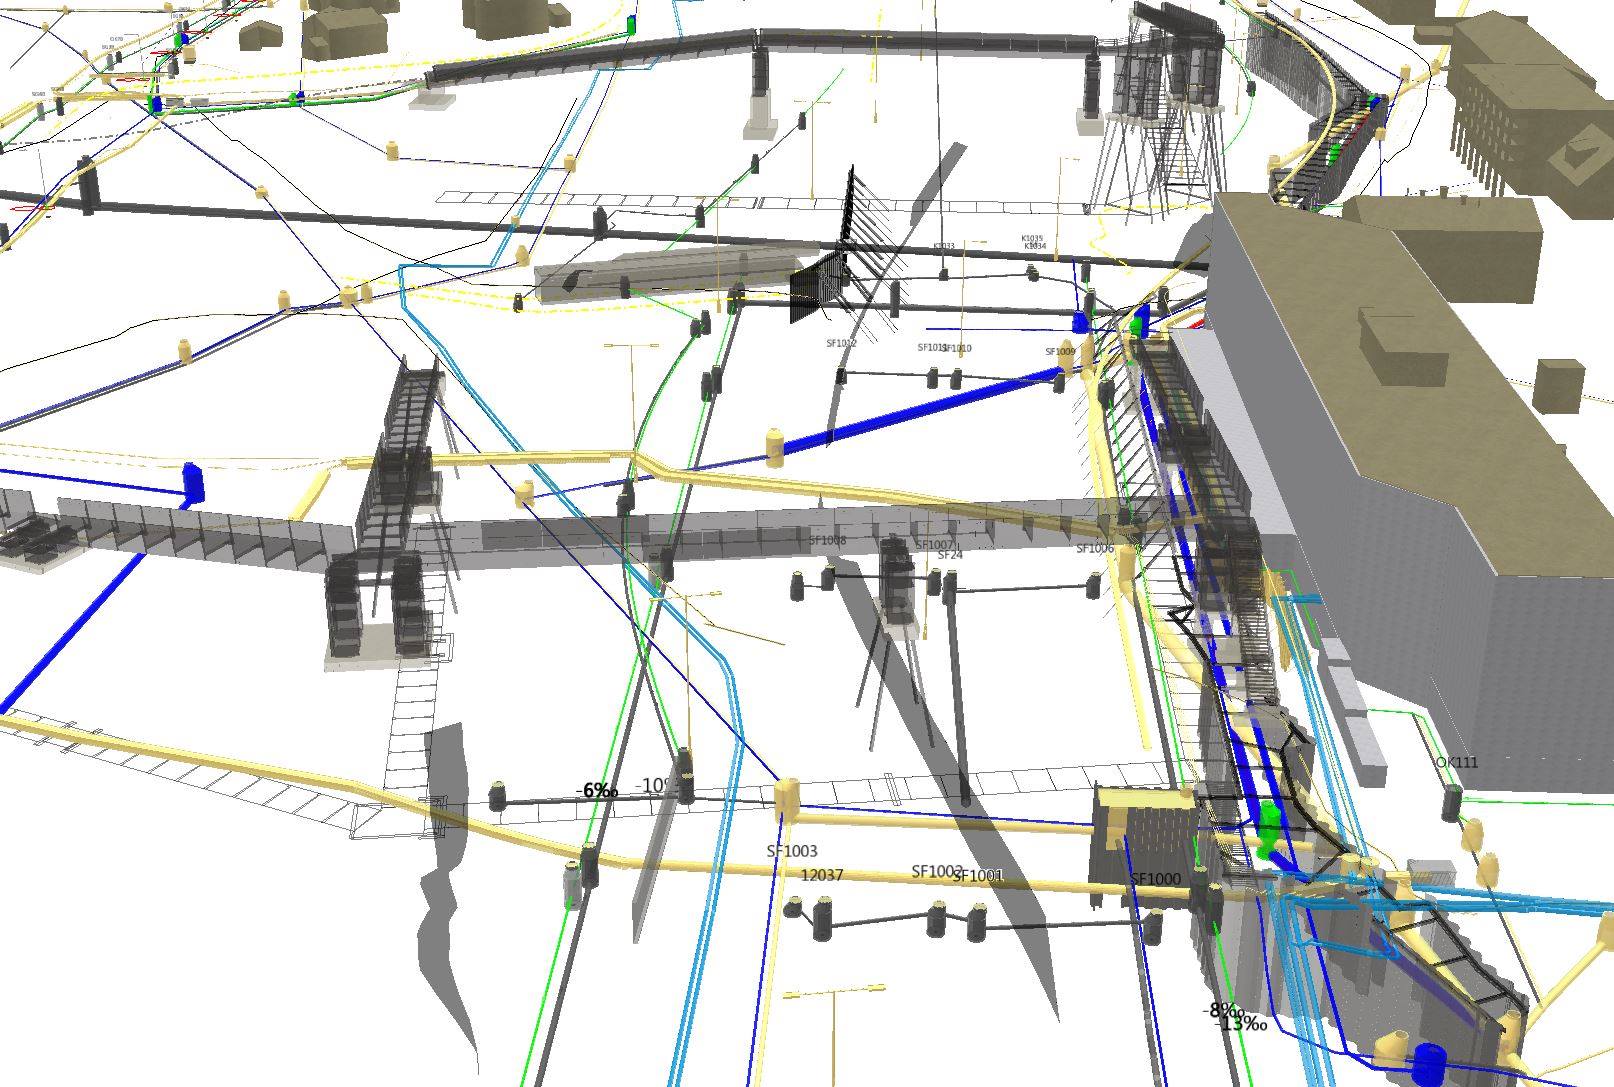
Combined with other data collected by Scan Survey, such as point clouds from Mobile Mapping or Drones, TIN of the terrain or positioning of pipelines with 3D-Pipelines, you as a client receive a complete design foundation. Contact Technical Manager Andreas Saxi Jensen for more information on solutions and prices!
